Mitchell Jones: Data-Driven Nerd
I am a Business Analytics major at the University of North Carolina at Charlotte.
In addition to my undergraduate Business coursework, I currently work as a Data Analyst Intern for Visual Risk IQ and serve as the President of the Business Honors Program at UNC Charlotte. You can find more Data Analytics-focused work on my Tableau Public Profile, here!
I am interested in Data Science Internships for the Summer of 2021 - connect with me here!
Project 1: Linear Regression using Gradient Descent: Interactive Demo
This is an interactive demo of of Linear Regression using the Gradient Descent algorithm. An user is asked to initialize a number of variables before being given the opportunity to change learning rate & epochs to gain intuition about the effects that parameter tuning has on a model.
This algorithm is currently available for use through packages like sci-kit learn, but I decided to code it from scratch myself, to force myself to understand the underlying math.
Here’s an image of the algorithm’s predictive line that it fit to the data. 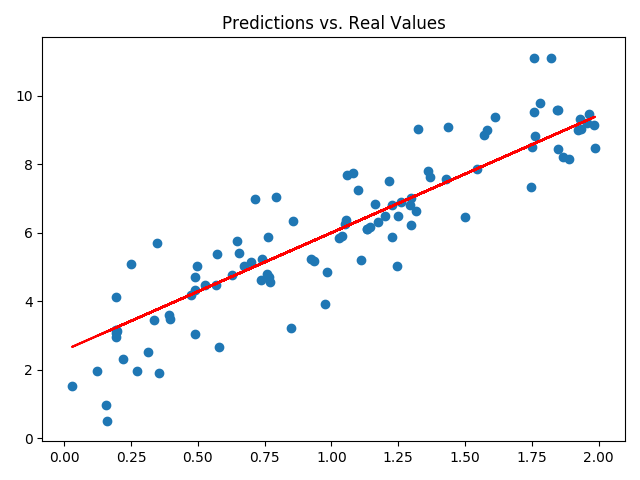
Future goals for this project include compatibility with other types of Gradient Descent such as Stochastic Gradient Descent or Mini-Batch Gradient Descent.
Project 2: Churn Analysis
As a financial services firm, it is very important to know which of your services that clients find most valuable. With this knowledge, you can prioritize discounts and predict which customers you can offer special deals to if you know they are likely to go to a competitor for similar services. To produce an example of this, I am using a dataset from Kaggle entitled “Telco Customer Churn.”
This is an example of a classification problem. It’s split into two portions - exploratory analysis and the process of building a model to predict which customers will churn.
Here’s an example of one of the visualizations from the exploratory analysis: 
Overall, in this project, I was able to build a variety of models and analyzed which parameters / approaches produce changes in accuracy, precision, and recall. My final result was a Naive Bayes model with 70% accuracy, 85% recall, 65% precision.
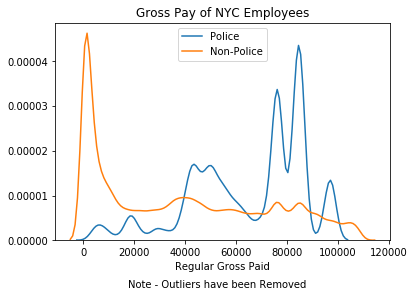
Project 3: New York Police Salary Data - Exploratory Analysis
This notebook is intended as a exploration of various statistics and comparisons surrounding NY Police Officer & Police Department salaries from the years 2014 - 2019. Given recent events and discourse on social media platforms like Twitter, I found it pertinent to explore these statistics with the aim of answering various questions, including:
- How are Police Officers paid differently from other city employees?
- What departments of the city are paid the most?
- Do Police Officers receive Overtime Pay at higher rates, or as a percentage of their salary?
Additional questions may include salaries for Police Department Employees, rather than just Police officers.
Source Data can be found here.